Schema Overview
This page displays information on all schemas available for a given species. It also contains a button  to return to the Schemas page.
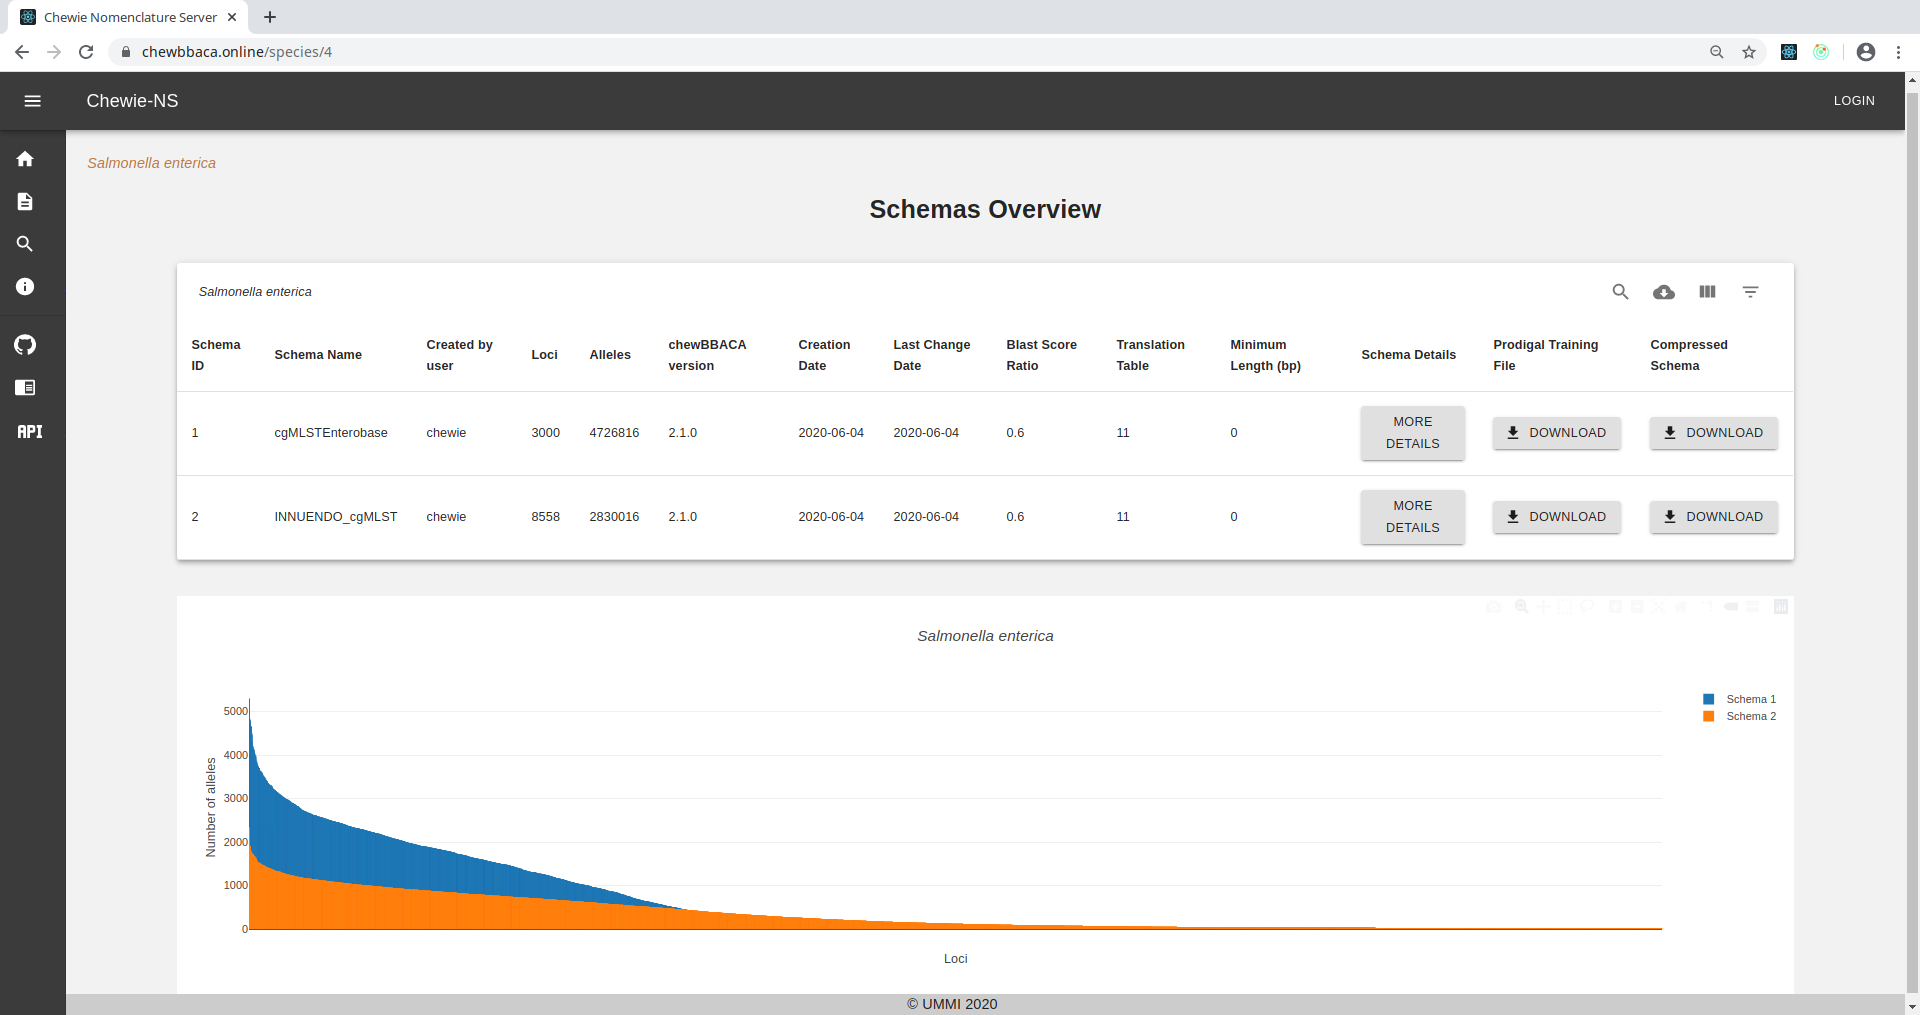
Figure 1.1: Schema Overview page.
Parameters table
The chewBBACA parameters used to create each schema are displayed on the following table:
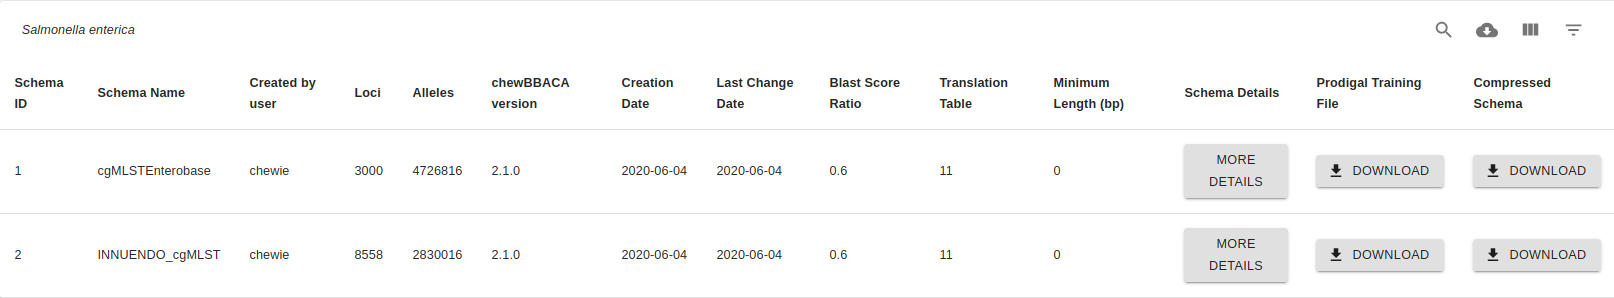
Figure 2.1: Parameters table.
The top-right buttons  of the table allow the user to:
Search for a particular schema on the table.
Download CSV will download the table in .csv format.
View Columns allows users to select which columns are displayed in the table.
Filter Table provides filtering options.
The parameters displayed on the table are the following:
Schema ID: the ID Chewie-NS assigned to the schema (it is a numerical value attributted automatically).
Schema Name: name of the schema as provided by the user.
Created by user: username of the schema creator (created when the user registered in the website).
Loci: the total number of loci in the schema.
Alleles: the total number of alleles in all the loci of the schema.
chewBBACA version: the version of chewBBACA used to generate the schema.
Creation Date: the creation date of the schema in the platform.
Last Change Date: the date of the latest schema modification.
Blast Score Ratio: the Blast Score Ratio used to generate the schema.
Translation Table: the translation table used to generate the schema.
Minimum Length (bp): the minimum coding sequence (CDS) length (bp) to be considered as a locus in the schema.
Schema Details: clicking on this button will take you to the Schema Evaluation and Annotation page showing more details on each schema.
Prodigal Training File: Click on this button to download the prodigal training file used to generate that particular schema.
Compressed Schema: Click on this button to download a compressed (.zip) version of the schema to use locally.
Schemas plot
The following barplot displays all the schemas described in the above table, showing each individual locus (x-axis), ordered by decreasing number of alleles in each locus, and the number of alleles (y-axis). You can zoom into a particular region of the chart by clicking and dragging on the region of interest.
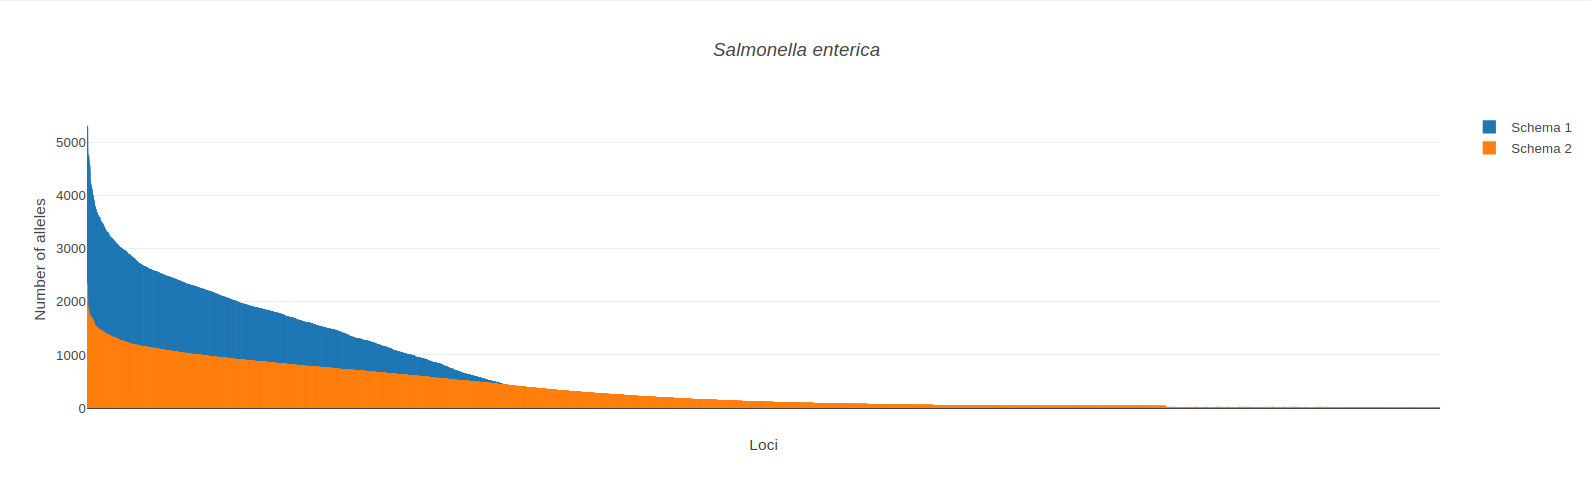
Figure 3.1: Bar plots for available schemas.
Important
Each bar represents a locus and by hovering on a bar, a popup will display the locus ID and the number of alleles of that locus. Moreover, if you click on the bar you will be redirected to the Locus Details page where additional information of that locus will be presented.
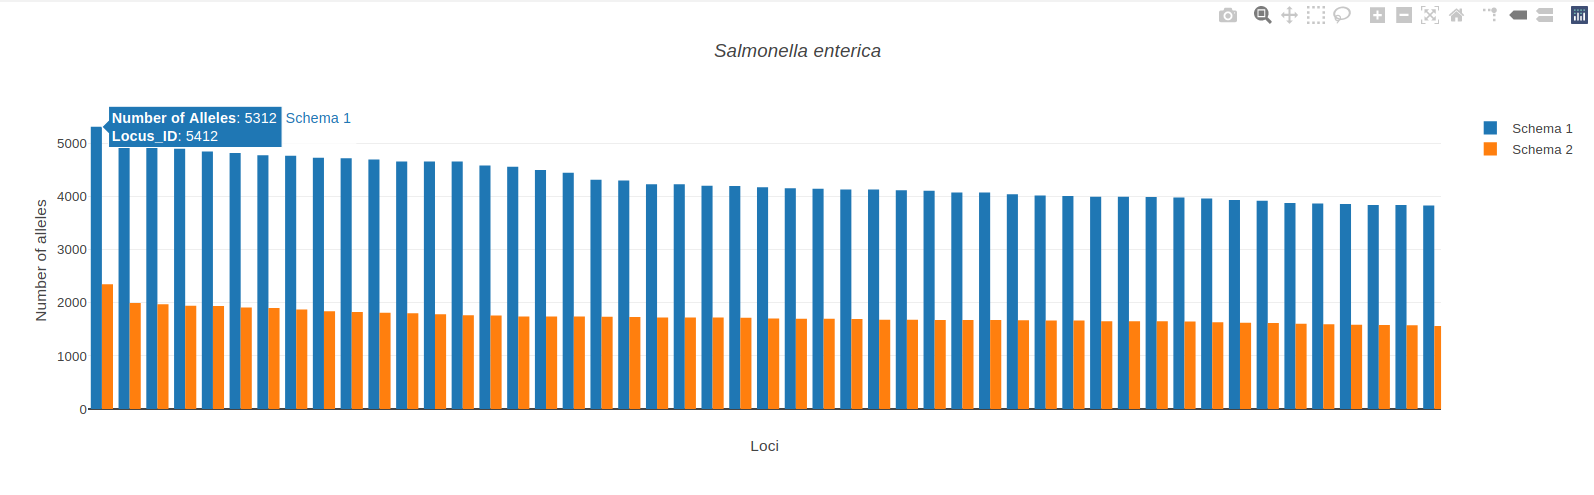
Figure 3.2: Plot bars display the Locus ID and the number of alleles.