Schema Evaluation and Annotation
This page displays details about a single schema. It also contains a button  to return to the Schemas page.
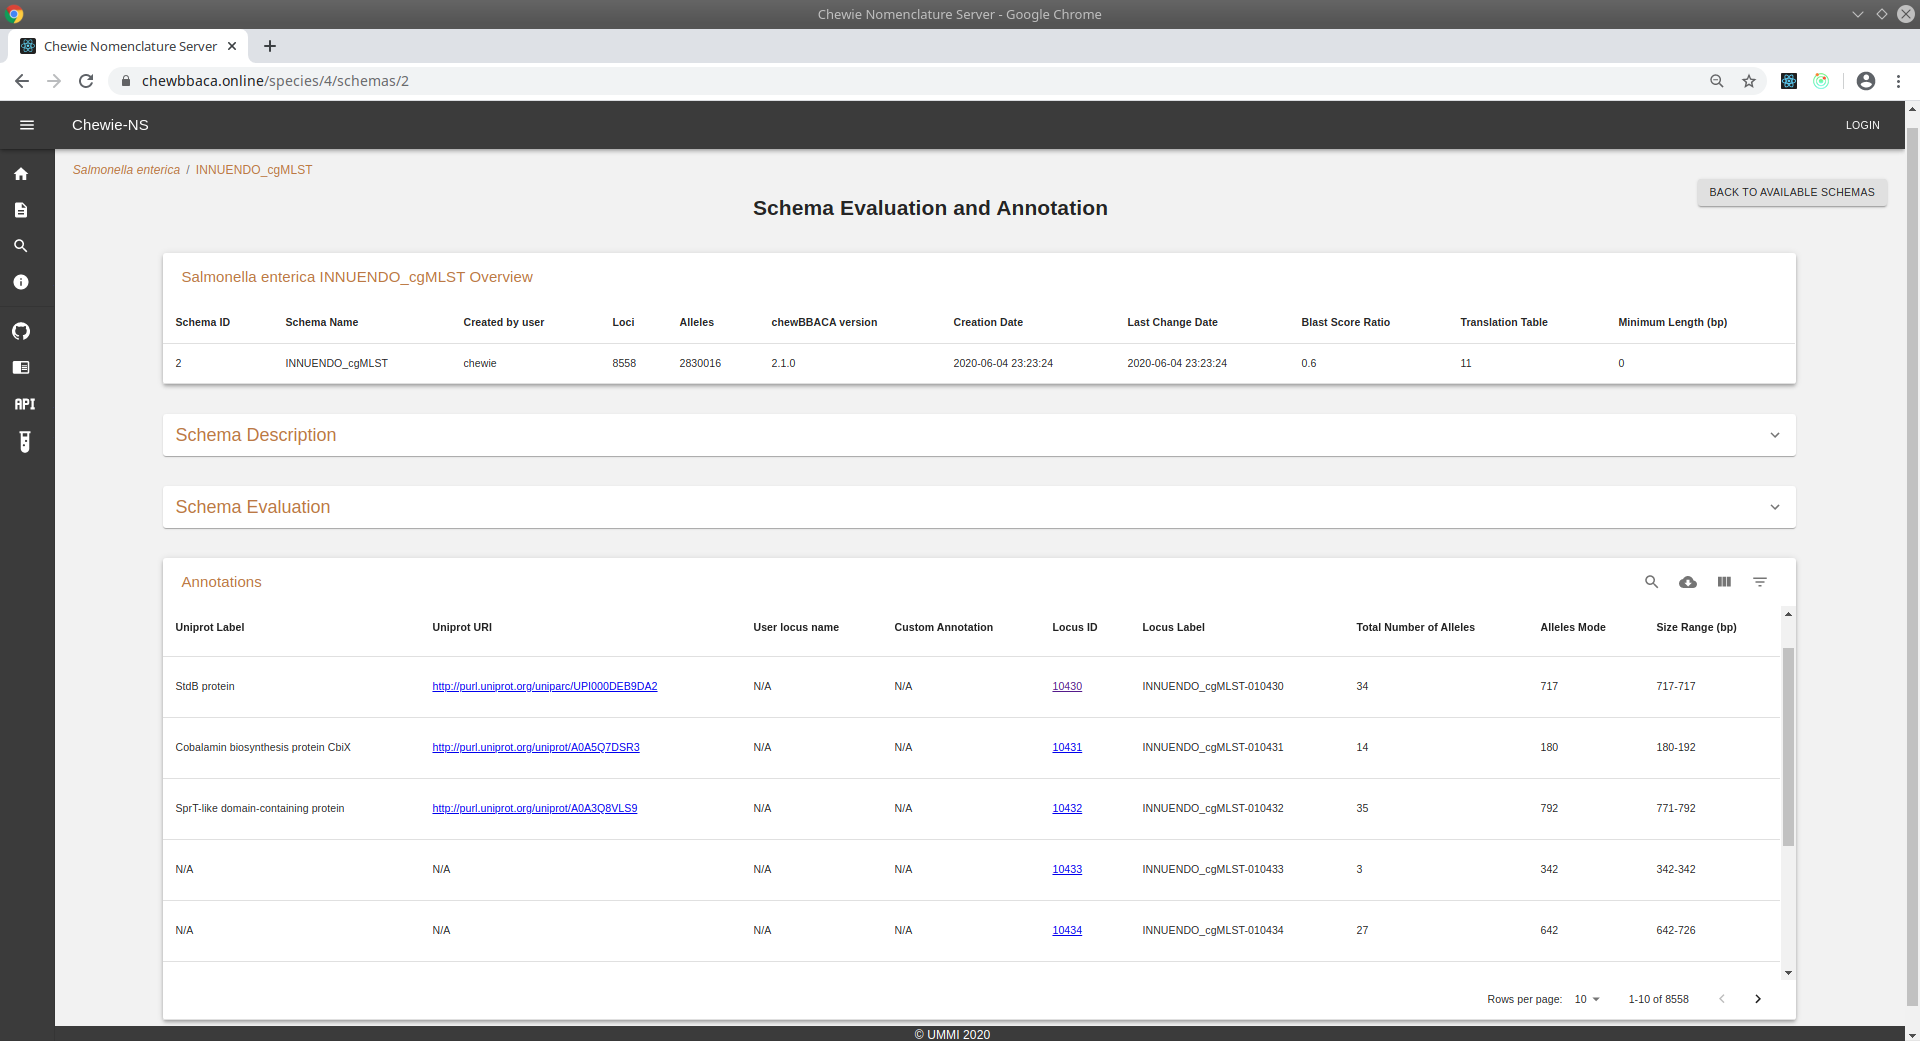
Figure 1.1: Schema Evaluation and Annotation page.
Parameters table
The chewBBACA parameter table is the same as the one described on the Schema Overview.
Schema Description
The Schema Description panel contains the description of the schema provided by the user (in Markdown format) during the schema upload.
If the user does not provide a description file, the name of the schema will be used as the schema description.
An example file is available at Chewie-NS’ repository.
For more information on the Markdown specification accepted by Chewie-NS please visit the Github Flavored Markdown Specification page.
Note
The Schema Description panel is by default expanded. It can be collapsed by clicking on the arrow icon on the upper-right corner of the panel.
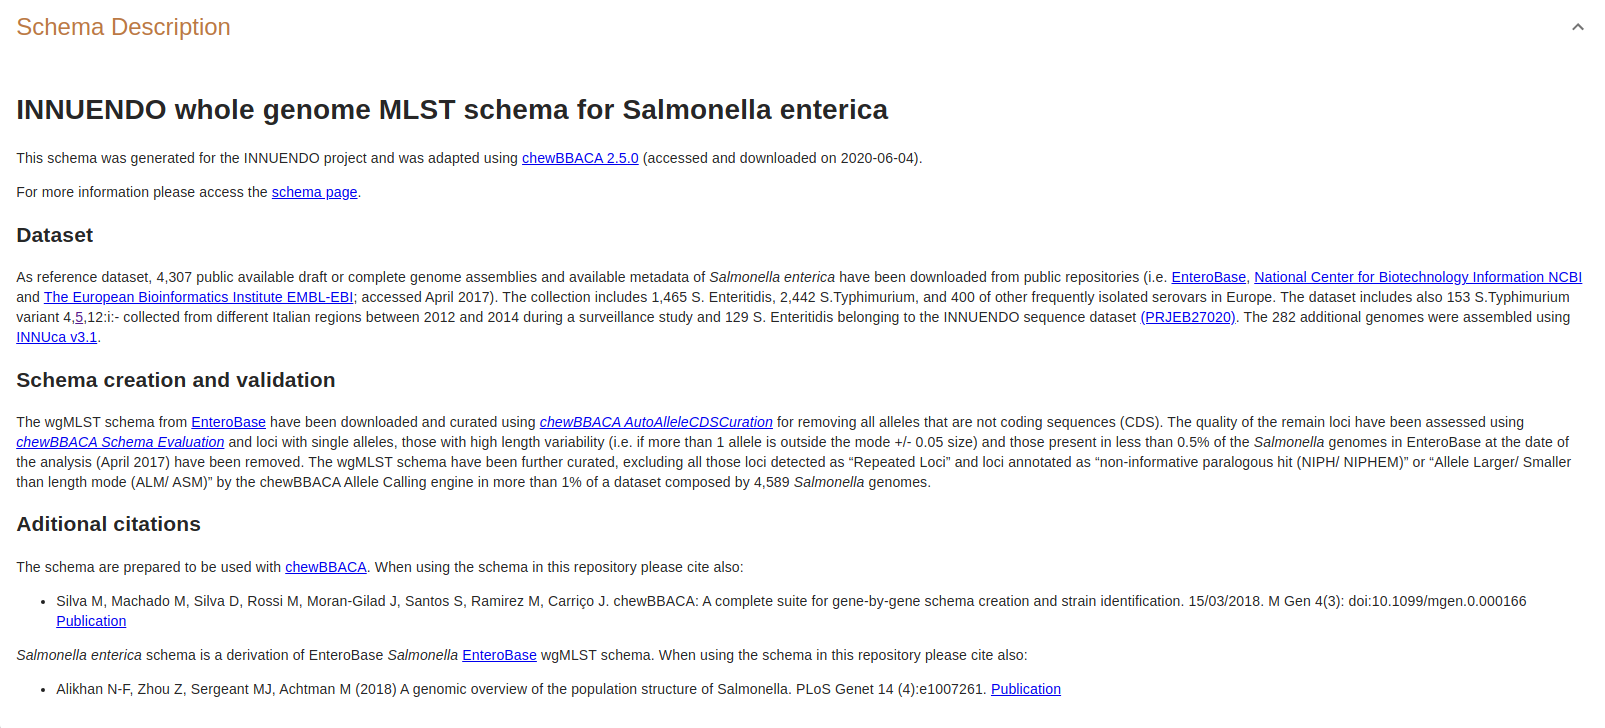
Figure 2.1: Schema Description panel.
Schema Evaluation
The Schema Evaluation panel contains 4 plots displaying basic statistics about the schema. The plots are displayed by clicking on the corrresponding buttons.
Note
The Schema Evaluation panel is by default expanded. It can be collapsed by clicking on the arrow icon on the upper-right corner of the panel.
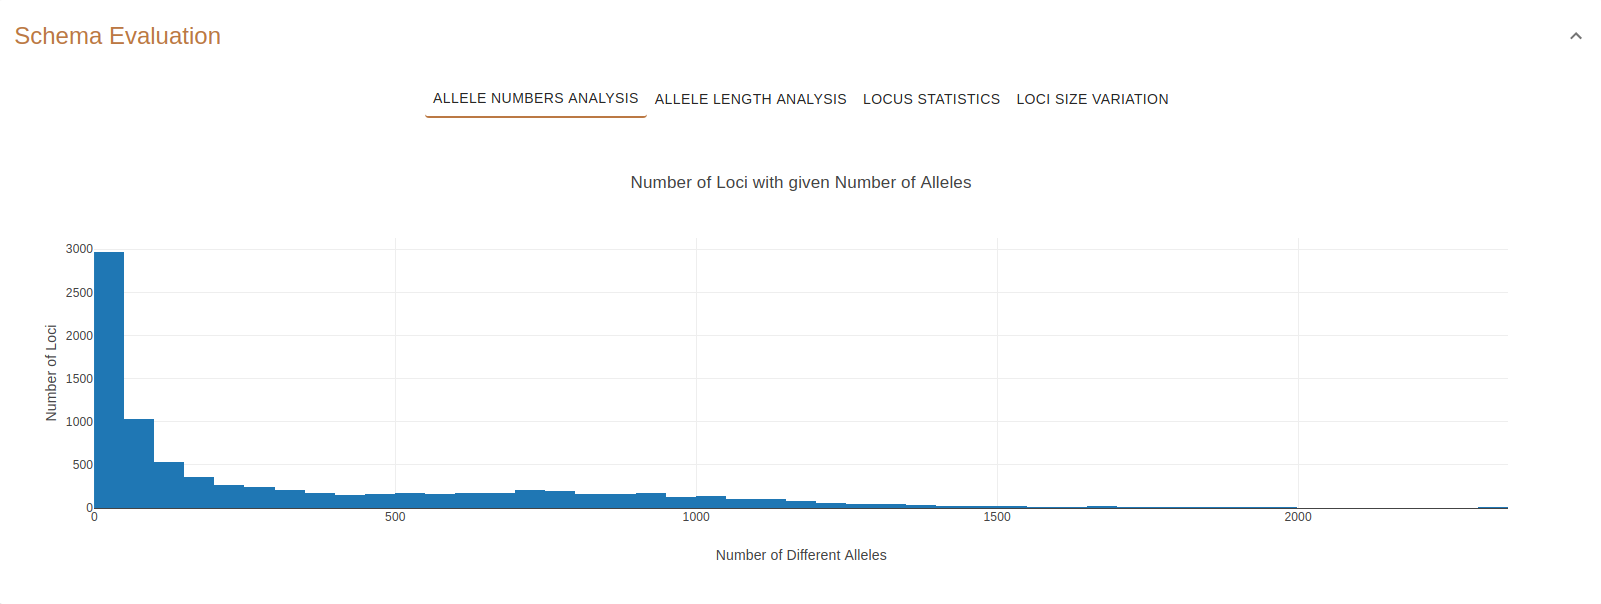
Figure 3.1: Expanded Schema Evaluation panel.

Figure 3.2: Collapsed Schema Evaluation panel.
Allele Numbers Analysis
In this plot, hovering above the bars will show how many loci (y-axis) exibit a number of different alleles (x-axis) within the range shown.
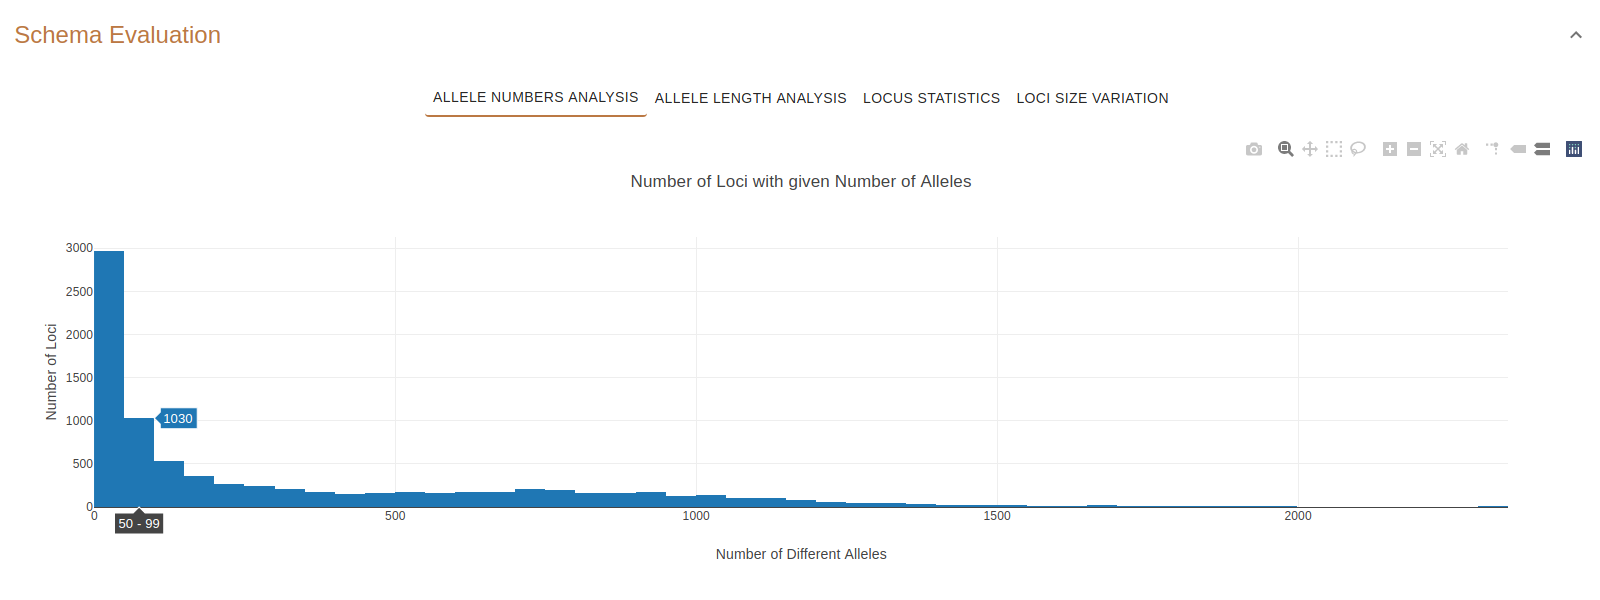
Figure 4.1: Number of loci (1030) that contain between 50 and 99 alleles.
Allele Length Analysis
In this plot, hovering above the bars will display the number of loci (y-axis) having an allele mode size (x-axis) within the range shown.
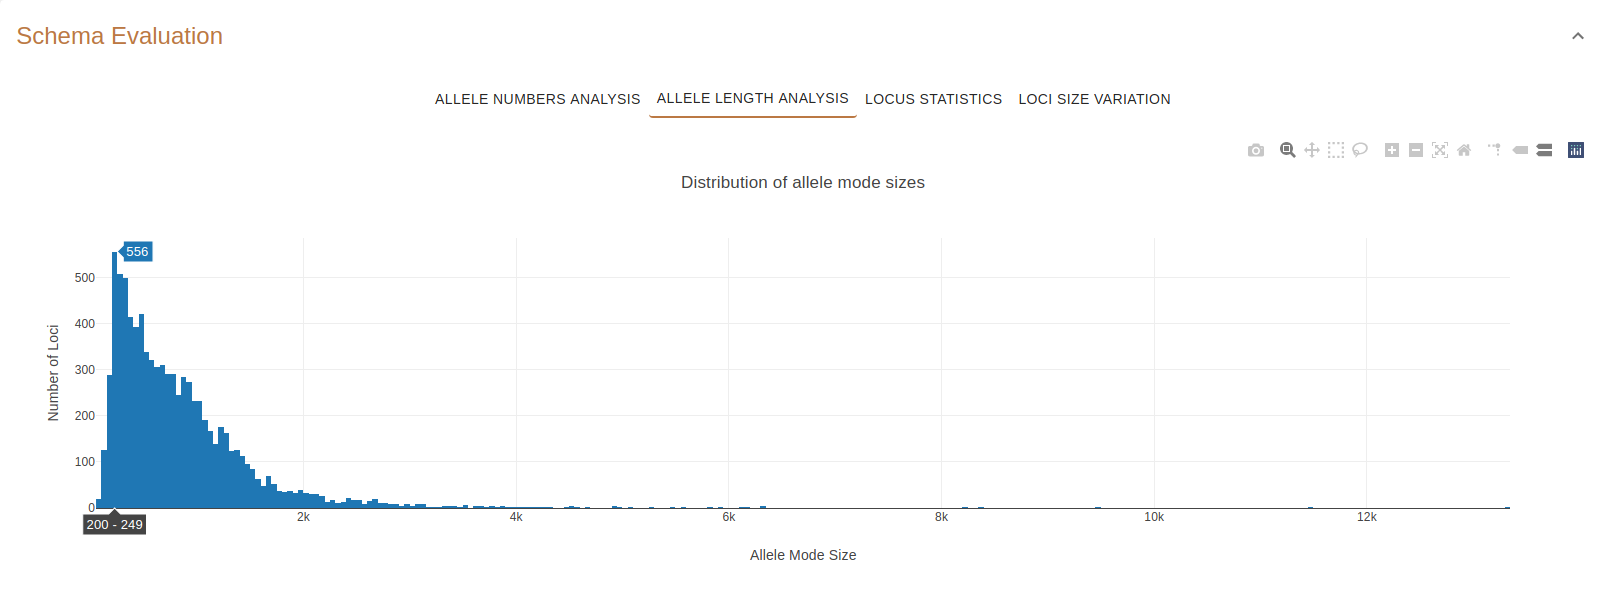
Figure 5.1: Number of loci (556) that have an allele mode size in the range 200-249 (bp).
Locus Statistics
This plot displays the number of alleles, the median and the size range (minimum and maximum) of the length of each locus.
The y-axis represents the number of alleles in the locus while the x-axis represents the median and the size range (minimum and maximum) of the length of the alleles in base pairs.
For example, Figure 8 shows that Locus 16801 has more than 1500 alleles (y-axis) and that the central tendency measures of allele length are similar are over 5500 base pairs.
Important
Clicking on the plot’s data points will take you the Locus Details page of that locus!
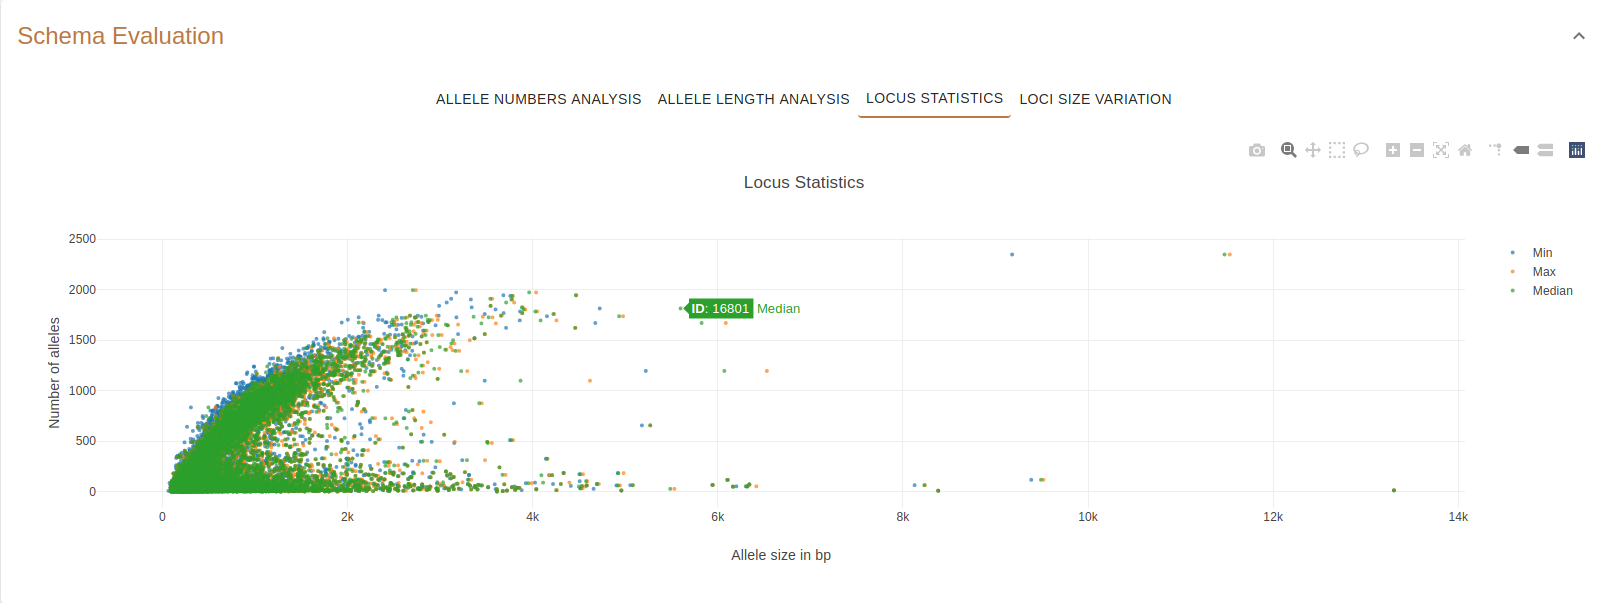
Figure 6.1: Locus 16801. Clicking on this point will open a page with the details of locus 16801.
Loci Size Variation
This plot displays the size variation of all the loci in the schema.
The y-axis represents the central tendency measures of the length of the alleles in base pairs and the x-axis represents the each loci.
Important
Clicking on the plot’s data points will take you the Locus Details page of that locus!
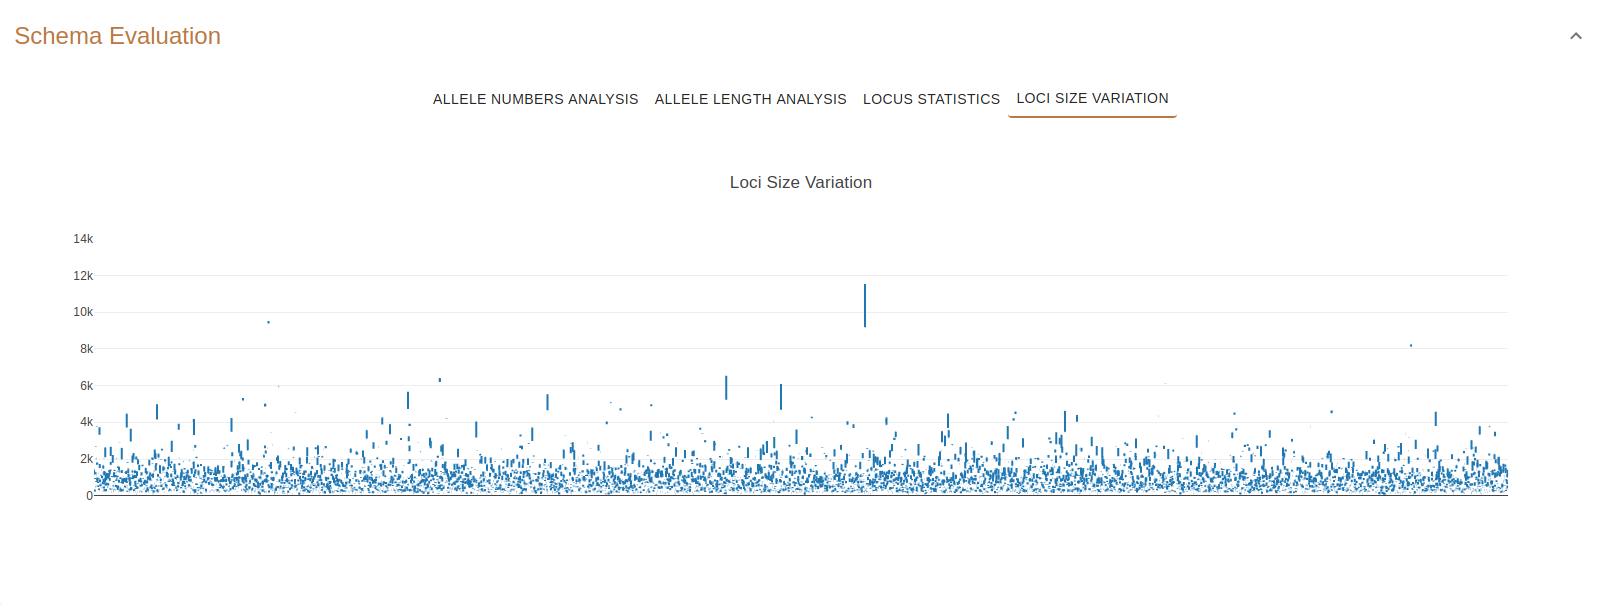
Figure 7.1: Loci size variation overview.
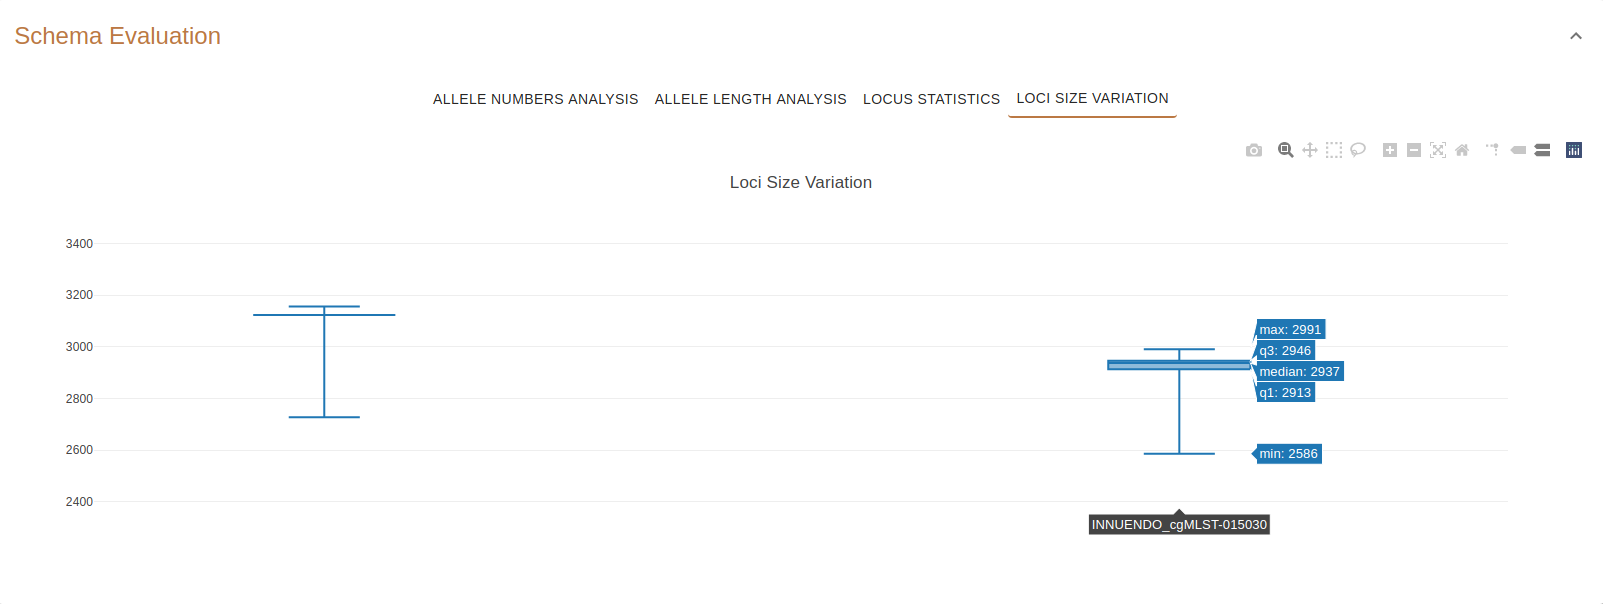
Figure 7.2: Locus 15030. Clicking on this point will open a page with the details of locus 15030.
Allele Timeline information
This plot displays the number of alleles added to the schema over time.
The y-axis represents the number of alleles added and the x-axis represents the date of the allele addition.
Annotations
The annotations table contains annotations for each locus of the schema.
The columns of the table are the following:
Uniprot Label: the Uniprot annotation.
Uniprot URI: the URI of the Uniprot annotation. Clicking on the URI will open the page of the relevant Uniprot annotation.
User locus name: a recognizable name for the locus provided by the user during the schema upload.
Custom Annotation: a custom annotation provided by the user during the schema upload.
Locus ID: the ID of the locus. Clicking on the ID will take you to the Locus Details page.
Locus Label: the Chewie-NS label assigned to the locus.
Locus Original Name: the original name of the locus in the original schema or in the genome from which the locus was identified.
Total Number of Alelles: the total number of alleles of that locus.
Alleles Mode (bp): the mode of the size of the alleles of that locus in base pairs.
Size Range (bp): the range of sequence lengths of the alleles of that locus in base pairs.
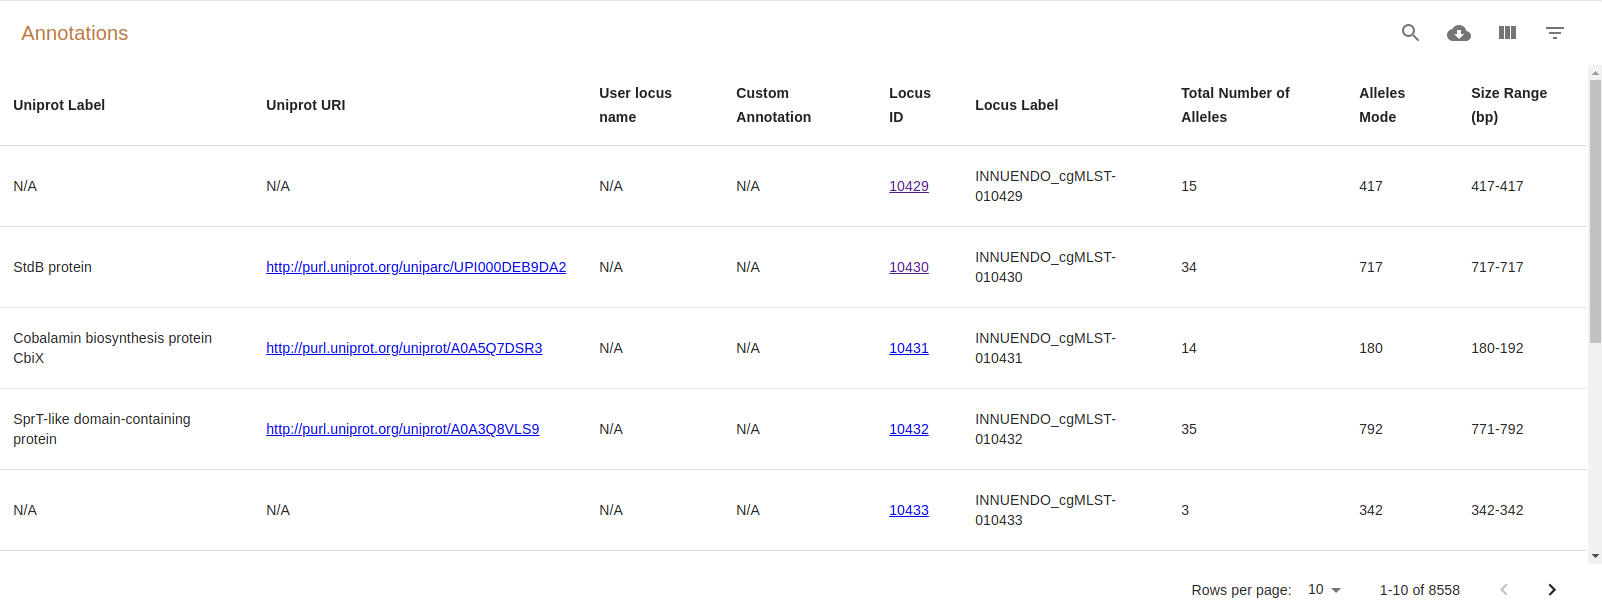
Figure 8.1: Annotations table.